Matrix Assesses Hawaii State Pensions' Long-Term Fiscal Health
Pew Trust Fact Sheet, March 31, 2022
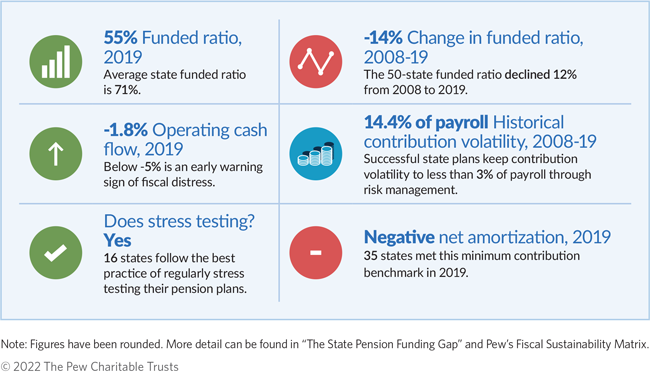
Hawaii’s contributions have fallen below minimum actuarial standards since 2011, which has caused the state’s funding level to decline from 94% in 2000 to 55% as of 2019. Although the latest data shows that Hawaii is paying less than what is needed to keep unfunded pension obligations from increasing, the state has been adhering to a schedule of contribution increases required by 2017 legislation. In addition, Hawaii’s 2020 stress test—an analysis of the plans’ fiscal health under different investment scenarios—indicates that the state can expect to meet The Pew Charitable Trust’s minimum standard by 2026.

The combination of a decade of increasing pension contributions and the strong market rally of 2021 has had a stabilizing effect on state pension plans. As a result, The Pew Charitable Trusts estimates that pension plan assets have risen by more than half a trillion dollars since 2011, leading to a 50-state funded ratio—the share of pension liabilities backed by plan assets—of over 80% and total state pension debt of less than $800 billion at the end of fiscal year 2021. This represents the highest funded ratio since before the Great Recession and the greatest progress in closing the state pension plan funding gap—the difference between plan liabilities and assets—this century.
However, not all state pension funds are approaching long-term fiscal sustainability, defined as government revenues matching expenditures without a corresponding increase in public debt. Although pension funds are currently benefiting from surging investment returns—which plans count on to cover 60% of the benefits they pay out—Pew estimates that long-term returns will decrease to about 6% annually, which is less than what most state pension plans are currently budgeting for.
To help policymakers navigate the uncertainty inherent in pension management and evaluate their plans’ resiliency, Pew has developed a 50-state matrix of fiscal sustainability metrics. The matrix highlights the practices of successful state pension systems, presenting critical data in a single table to facilitate comparative analyses and state plan assessments. Specifically, these data points illuminate historical outcomes from policy choices, measures of cash flow that determine long-term solvency, and indicators of risk and uncertainty.
Why do the metrics above matter, and what do they mean?
--Historical actuarial metrics such as funded ratio—the value of a plan’s assets in proportion to the pension liability—and change in funded ratio over time highlight past policies’ impact on a plan’s current financial position. These metrics are the foundation of any fiscal assessment; however, they provide little information to assess future investment or contribution risks.
--Current plan financial metrics speak directly to whether existing policy is sufficient to pay down unfunded liabilities and help public employees and taxpayers determine whether a plan is following funding policies that target debt reduction or if it is at risk of fiscal distress. The metrics are operating cash flow ratio—the difference, before investment returns, between payments and contributions, divided by assets—and net amortization, which measures whether total contributions to a public retirement system would have been sufficient to reduce pension debt if all actuarial assumptions (primarily investment expectations) had been met for the year. Based on historical cash flows and funding patterns, these metrics aid in assessing the risk of future underfunding or insolvency.
--State budgetary risk metrics, such as historical contribution volatility—the range between the lowest and highest employer contribution rate over a fixed period—and the regular practice of pension stress testing, are designed to assist policymakers as they plan for uncertainty or volatile costs in the future. Because state and local budgets often bear much or all of the risks taken on by public pension plans, these metrics are essential for long-term planning and can prompt reforms where needed.
---30---
FLASHBACK: Act 100: How Hanabusa and Cayetano launched Hawaii Pension crisis