Gross Domestic Product by State, 4th Quarter 2020 and Annual 2020 (Preliminary)
South Dakota had the largest increase in the fourth quarter
News Release from BEA, March 26, 2021
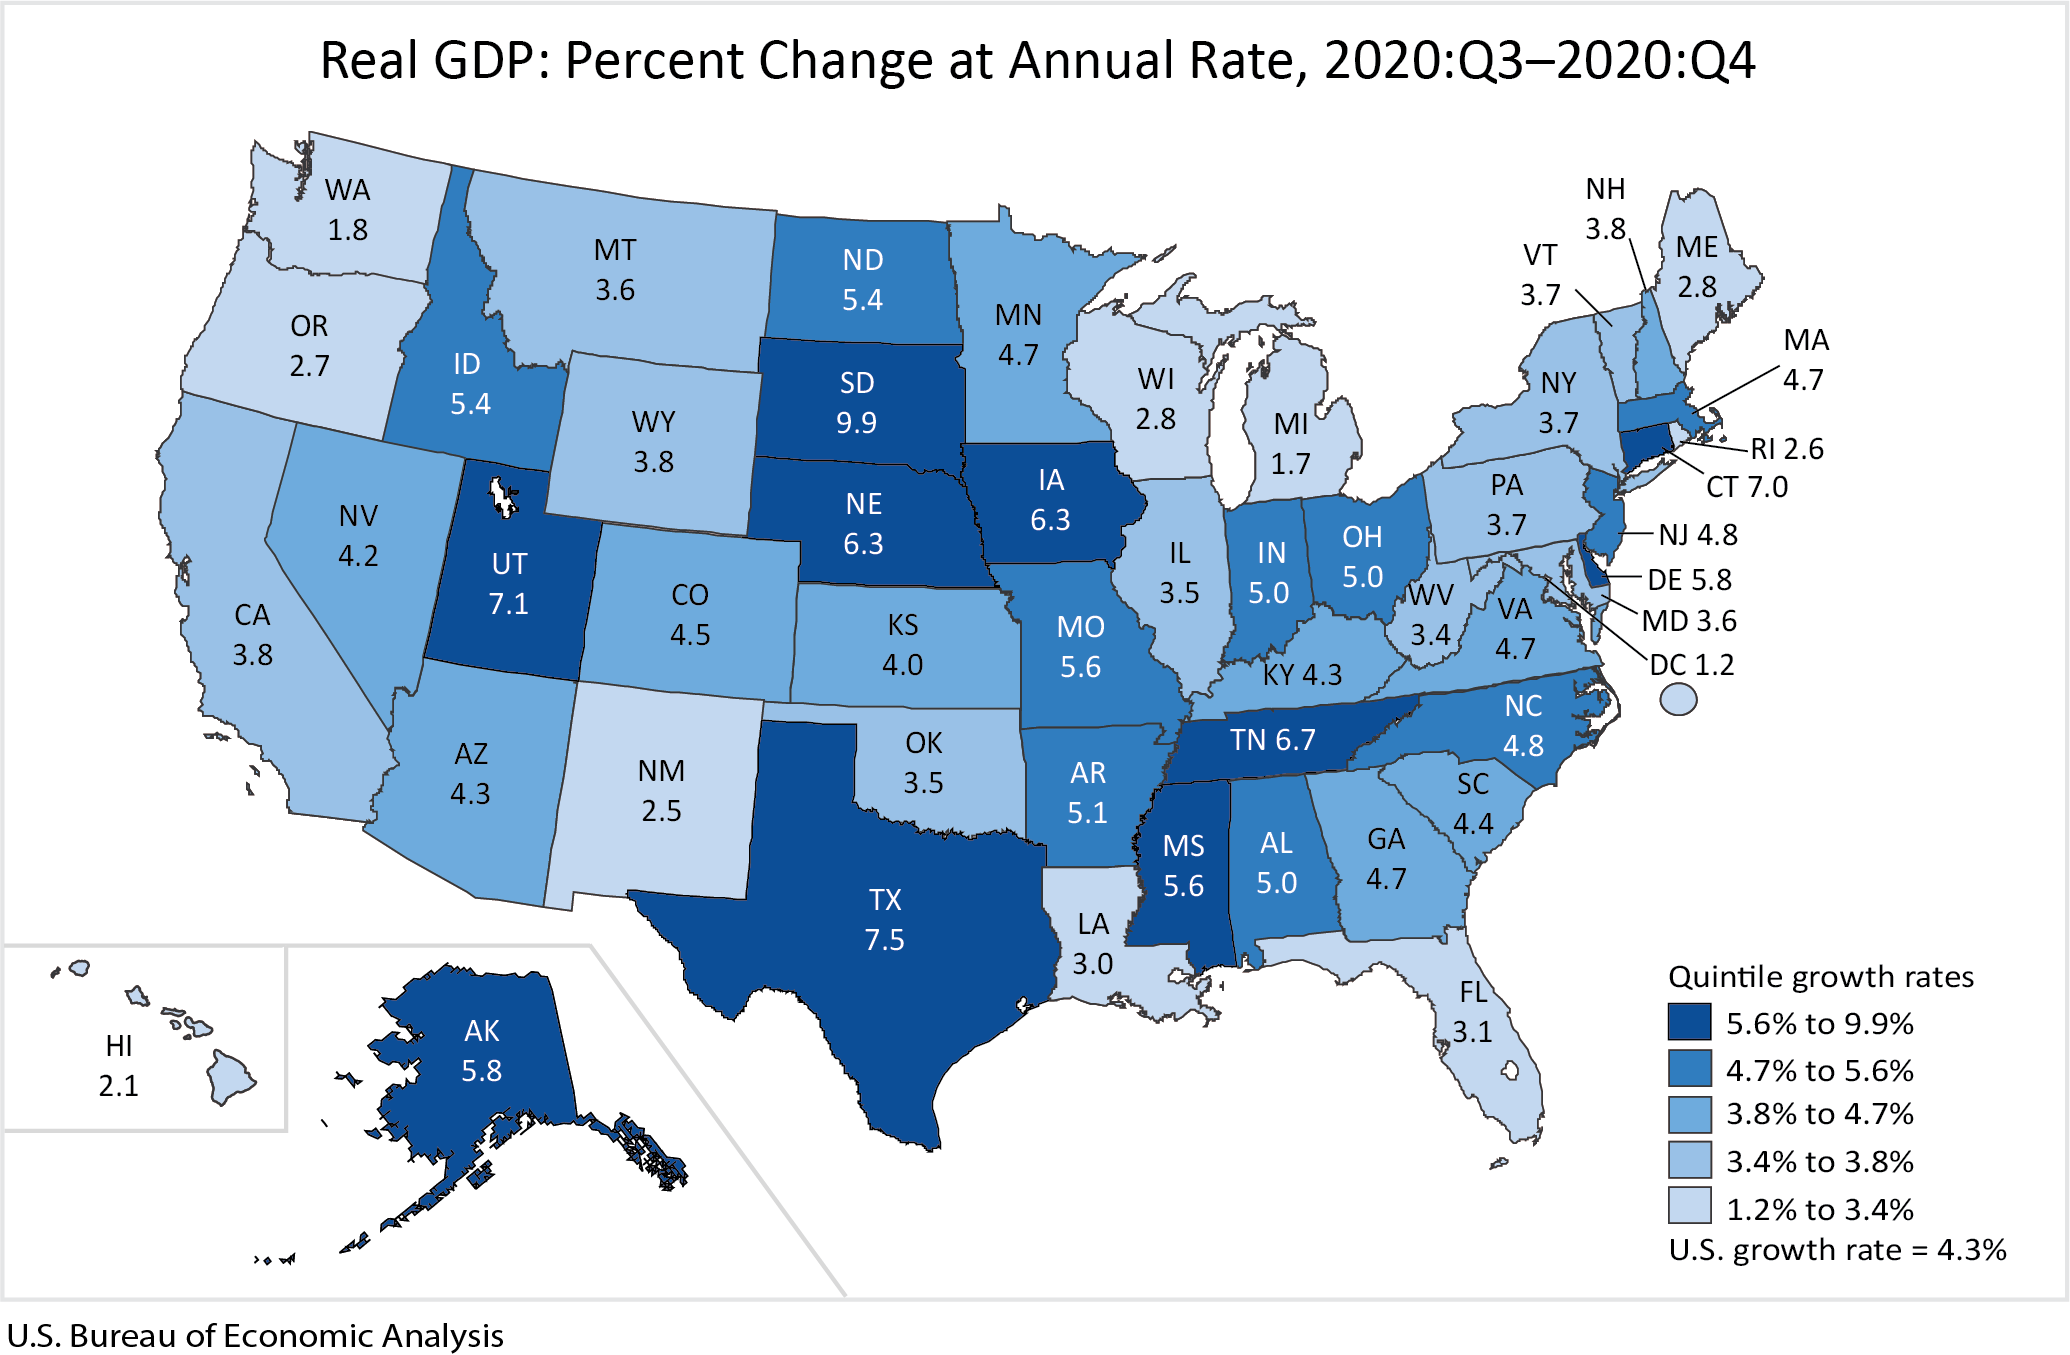
Real gross domestic product (GDP) increased in all 50 states and the District of Columbia in the fourth quarter of 2020, as real GDP for the nation increased at an annual rate of 4.3 percent, according to statistics released today by the U.S. Bureau of Economic Analysis. The percent change in real GDP in the fourth quarter ranged from 9.9 percent in South Dakota to 1.2 percent in the District of Columbia (table 1).

Finance and insurance; healthcare and social assistance; and administrative and support and waste management and remediation services were the leading contributors to the increase in real GDP nationally (table 2).
Other highlights
Finance and insurance increased 12.9 percent nationally and contributed to the increases in all 50 states and the District of Columbia. This industry was the leading contributor to the increases in 25 states including South Dakota, Texas, Utah, and Connecticut, the states with the four largest increases.
Healthcare and social assistance increased 8.3 percent nationally and contributed to the increases in all 50 states and the District of Columbia. This industry was the leading contributor to the increase in seven states including Tennessee, the state with the fifth largest increase.
Administrative and support and waste management and remediation services increased 21.1 percent nationally and contributed to the increases in all 50 states and the District of Columbia.
Accommodation and food services decreased 7.1 percent nationally. This industry moderated increases in real GDP in 38 states.
Coronavirus (COVID-19) Impact on Fourth-Quarter 2020 and Annual 2020 GDP by State Estimates
The increases in fourth-quarter GDP by state reflect both the continued economic recovery from the sharp declines earlier in the year and the ongoing impact of the COVID-19 pandemic, including new restrictions and closures that took effect in some areas of the United States. The annual 2020 estimates of GDP by state reflect the rapid shifts in activity, as business and schools switched to remote work, consumers and businesses canceled, restricted, or redirected their spending, governments issued and lifted "stay-at-home" orders and government pandemic assistance payments were distributed to households and businesses. The full economic effects of the COVID-19 pandemic cannot be quantified in the GDP by state estimates because the impacts are generally embedded in source data and cannot be separately identified.
GDP by State, Annual 2020
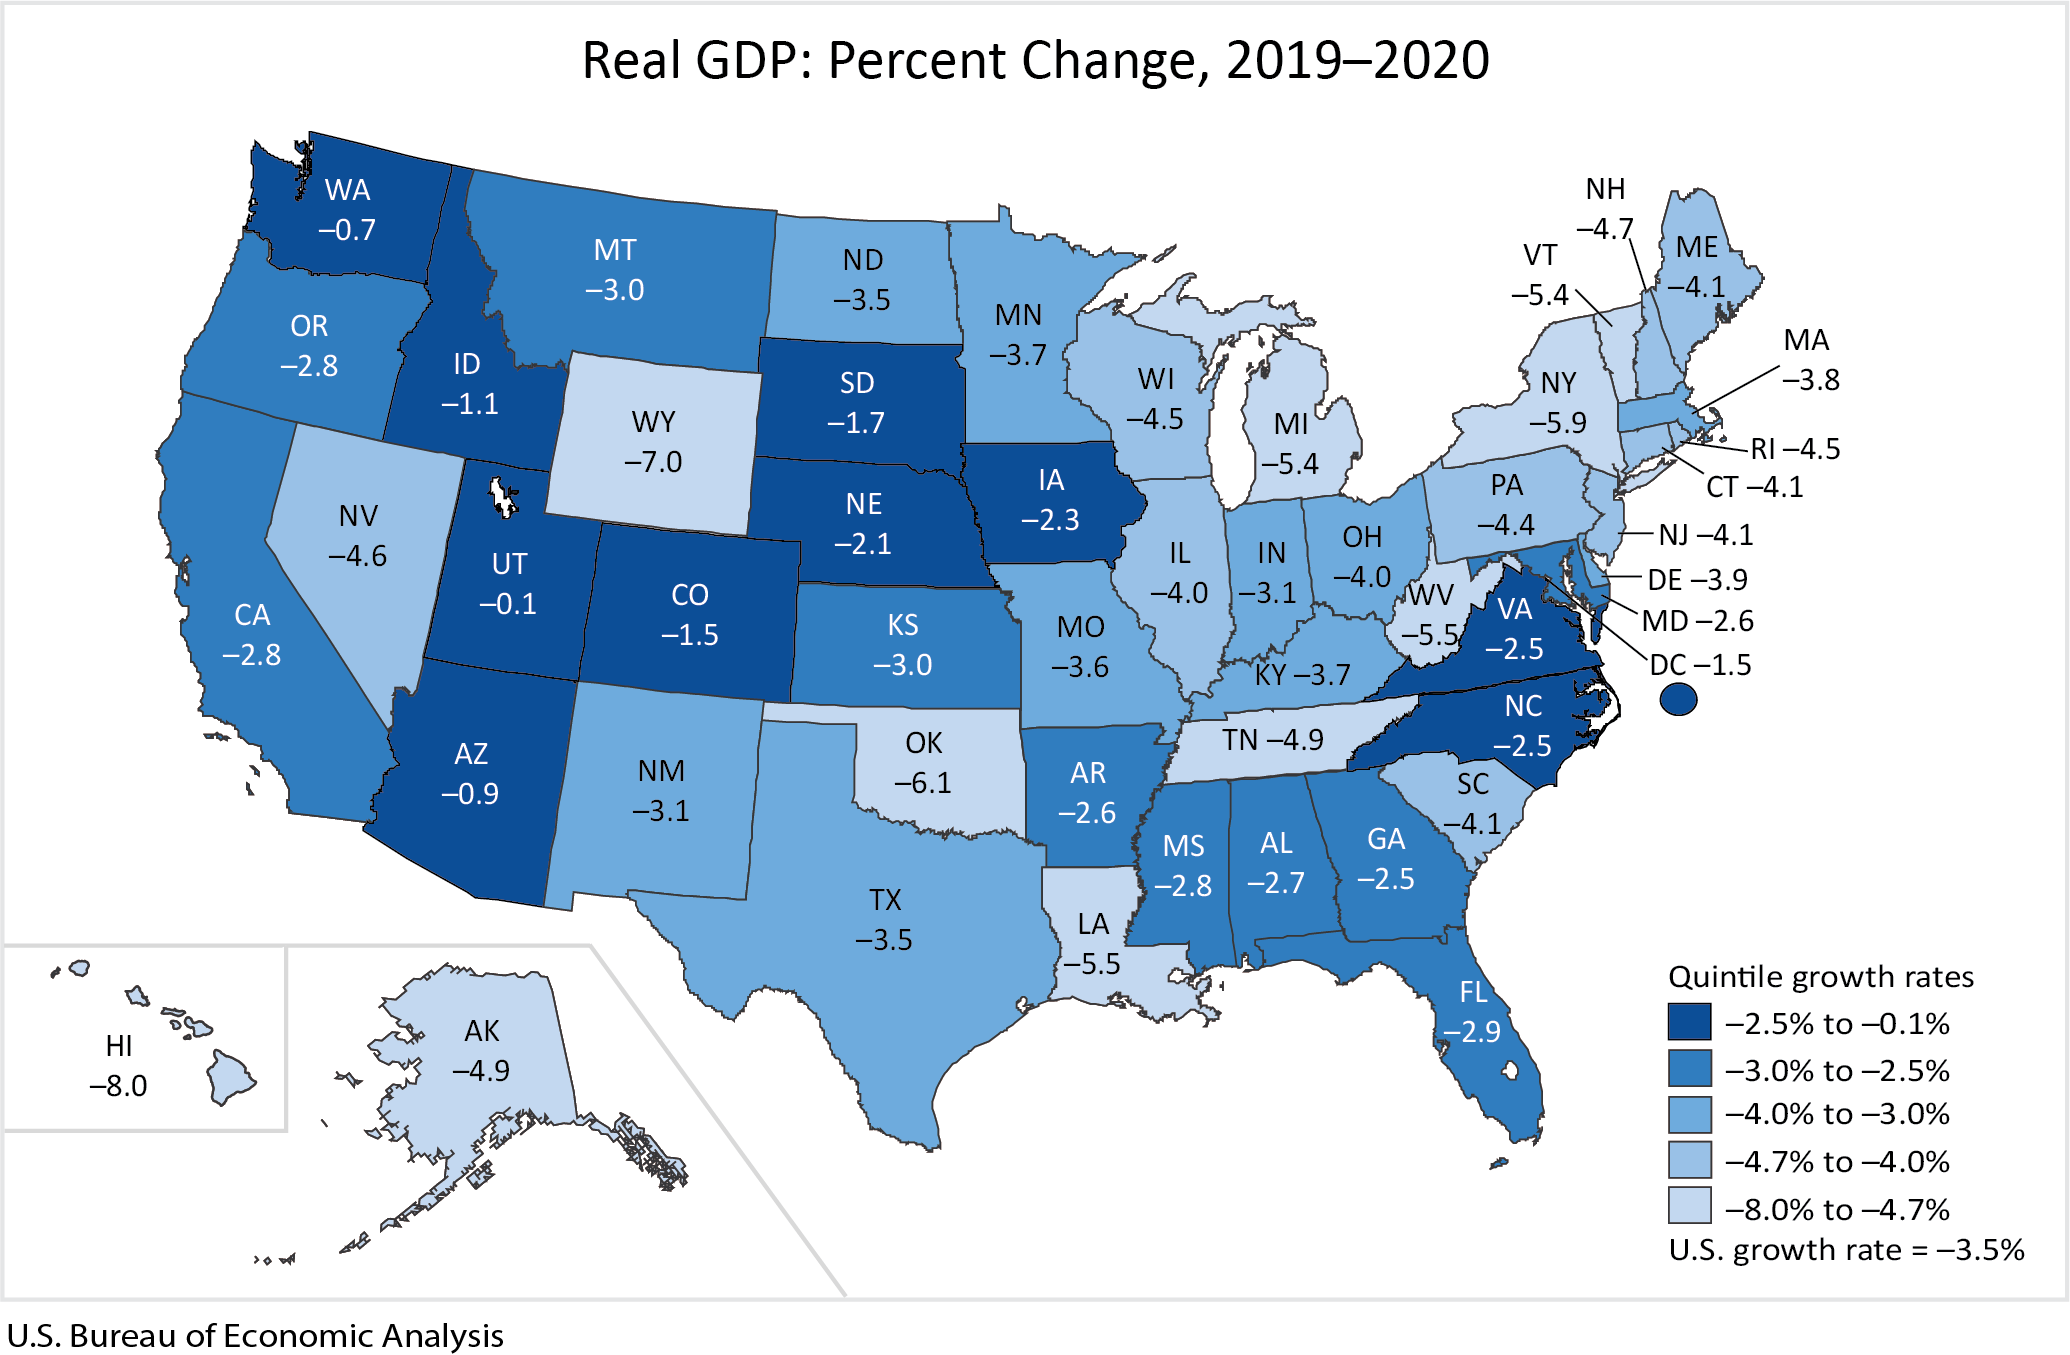
Real GDP decreased in all 50 states and the District of Columbia in 2020. The percent change in real GDP ranged from –0.1 percent in Utah to –8.0 percent in Hawaii (table 4).

Accommodation and food services; arts, entertainment, and recreation; and healthcare and social assistance were the leading contributors to the decrease in real GDP nationally. Accommodation and food services was the leading contributor to the decrease in Hawaii (table 5).
Other highlights
Accommodation and food services contributed to the decreases in all 50 states and the District of Columbia. This industry was also the leading contributor to the decreases in 38 states and the District of Columbia, including New York, the fourth slowest growing state.
Both arts, entertainment, and recreation and healthcare and social assistance contributed to the decreases in all 50 states and the District of Columbia.
Construction and finance and insurance were the leading contributors to moderating the decrease in Utah, the state with the smallest decline.
Next release: June 25, 2021, at 10:00 A.M. EDT
Gross Domestic Product by State, 1st Quarter 2021