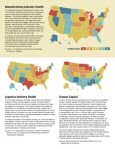
From 2014 Manufacturing and Logistics Report published by the Center for Business and Economic Research, Ball State Univ, Muncie, Indiana.
The 2014 Manufacturing and Logistics Report shows how each state ranks among its peers in several areas of the economy that underlie the success of manufacturing and logistics.
These specific measures include the health of the manufacturing and logistics industries, the state of human capital, the cost of worker benefits, diversification of the industries, state-level productivity and innovation, expected fiscal liability, the state tax climate, and global reach.

2014 National Report Card (PDF)
About the Grades
The categories in this report were chosen as those most likely to be considered by site selection experts for manufacturing and logistics firms, and by the prevailing economic research on growth.
Each category included multiple variables for each state that were aggregated and then ranked 1st through 50th, with 1st being the most desirable. Within each category, the lowest aggregate score assigned provided the overall rank. Grades were assigned A through F using a normal distribution of grades commonly known as a bell curve. Plus and minus scores were not assigned to A or F grades
LINK: 2014 Manufacturing and Logistics Report
LINK: About Hawaii
Hawaii has a population of 1,374,810. The manufacturing industry is 1.3% of the state economy. The total personal income in Hawaii is $59,189,985,000 and earnings from manufacturing total $786,571,000.
Hawaii
Click on a category to view state performance in that category
* * * * *
2013: Productivity and Innovation: Hawaii Tumbles from ‘A’ to ‘F’
2012: Hawaii Scores 'F' For Logistics Industry Health