Click image to download a four-page PDF of this policy brief.
Honolulu’s Terrible Folly and a Transit Mystery
By Randal O'Toole, The Antiplanner, January 28, 2020
Honolulu is building what may be the most expensive above-ground rail line in the world. The 20-mile line is expected to cost $9.2 billion, more than the cost of the 243 miles of light-rail lines in Sacramento, Saint Louis, Salt Lake City, San Diego, and San Jose combined. While the FTA classifies Honolulu’s line as heavy rail, it’s passenger capacity will be about the same as light rail, as platforms will only be large enough for four-car trains.
Meanwhile, the city’s transit ridership is plummeting, having fallen by 21 percent since rail construction began. Rail ridership projections assumed bus ridership numbers would grow by more than 50 percent, not decline.
A close look at bus data suggests that most of the ridership decline is among commuters, and most of those commuters appear to be switching to driving their own cars or working at home, not ride hailing. The historic cost data also reveals a mystery that may say something about how Honolulu has chosen to manage its transit systems.
The island of Oahu makes up Honolulu County, and the city and county of Honolulu have a consolidated government. Rather than have a separate transit agency with its own taxing authority, Honolulu manages its transit system, known as TheBus, itself.
The rail line is being built by a separate agency in the city government known as Honolulu Area Rapid Transit (HART). In 2011, HART projects that, when the line is completed, it will cost about $126 million a year to operate. The actual cost will probably be much more if only because of inflation.
Transit’s Decline
Honolulu owns about 600 buses that serve more than 100 different routes. This is in addition to the city’s demand-response or paratransit system, which I’ll mostly ignore here. In 2018, Honolulu spent $203 million operating the bus system, which means that one rail route will cost more than 60 percent as much to operate as more than 100 bus routes.
According to the National Transit Database time series, bus ridership peaked in 2012 at 76.3 million trips. Since then, according to the database’s monthly updates, it declined by 21 percent to 61.2 million trips in 2019. (Numbers are for Honolulu’s fiscal years, which end on June 30.)
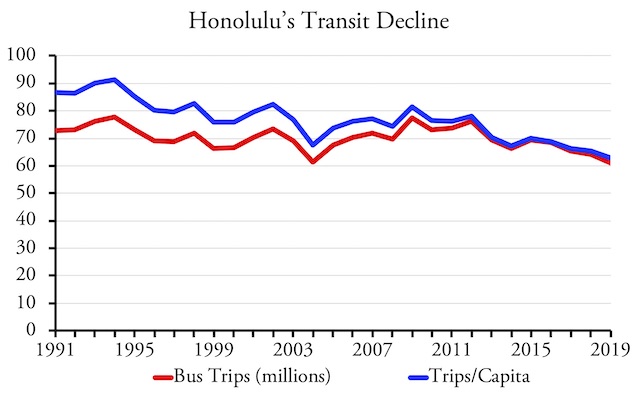
Although ridership in 1994 and 2012 were almost the same, a growing population reduced per capita ridership from 91 trips per year in 1994 to 78 in 2012. The 2019 per capita ridership is estimated to be just 63 trips.
Table B08301 of the American Community Survey estimates that about 42,000 people took transit to work on Oahu in 2012, increasing to 46,000 in 2015, then dropping to 36,000 in 2018. The Census Bureau says Honolulu’s transit commute numbers are accurate within roughly plus or minus 10 percent, so the increase from 2012 to 2015 is within the margins of error (i.e., there may not have been a real increase), but the decrease from 2015 to 2018 is not (i.e., the decline was real).
Most transit commuters will take a round trip by transit each workday, which is two separate trips. If they have to change buses along the way in each direction, that’s counted as four trips per day. There are about 225 work days in a year, but a Department of Transportation survey (see page 78) found that people who report on census forms that they “usually” take transit to work actually do so only about 71 percent of the time. People who say they usually take another mode to work occasionally take transit, so the net effect is that, on any given workday, the actual number of transit commuters is about 75 percent of the number reported by the American Community Survey.
Based on these numbers, a reasonable first approximation is that each transit commuter takes about 400 transit rides a year (200 round trips). This means the drop from 2015 to 2018 represents about 4 million transit rides. The actual decline in that time period was about 5.2 million, so commuters made up most if not all of the decline.
What happened to those former transit commuters? The data indicate that, between 2015 and 2018, the number of people who took a taxi to work—which is the category that would include ride hailing—increased from 387 to 401. But the margins of error for taxi numbers were around 300 so this isn’t significant. Meanwhile, the number of automobile commuters grew by 6,200 and the number of people who worked at home grew by 3,600. In addition, the total number of workers in the county declined by 4,200. The number of people who rode a motorcycle, bicycled, or walked to work all also declined.
In short, perhaps 10,000 people switched from transit commuting to working at home or commuting by automobile. It’s safe to say that, if ride hailing captured any former transit commuters, it didn’t capture many.
Nor do changes in service levels appear to be responsible for the decline in transit commuting. Between 2012 and 2015, when transit commuting rose by 11 percent, vehicle revenue miles of service declined by 2.5 percent. Between 2015 and 2018, when transit commuting fell by 22 percent, miles of service increased by 1 percent. So the changes in transit ridership appear to be due to people’s preferences for driving and, perhaps, high housing costs forcing low-income workers who rode transit to move elsewhere.
Honolulu’s transit decline should be particularly distressing for the industry as a whole because the city’s transit system was a shining example of how well transit could work in a relatively small urban area. Honolulu was ranked the 54th largest urban area in 2010. At that time its transit system was, by some measures, the second-most successful system in the country after only New York’s. Now it is around eighth or ninth and slipping fast.
Other urban areas about the size of Honolulu include Birmingham, El Paso, and Omaha. In 1970, transit’s share of commuting in these urban areas was around 9 percent, but since then it has fallen to around 1 to 2 percent. Honolulu’s was also around 9 percent in 1970 but remained at 9 percent in 2010. It even briefly exceeded 10 percent in 2014 and 205.
Since Honolulu has an urban-growth boundary and is one of the densest urban areas in the United States, this gave hope to planners who believed that population density was the key to transit ridership. But transit’s share fell to 8 percent in 2018 and will be even lower in 2019, showing that density isn’t the solution, especially when it comes with high housing costs and other problems.
The reality is that density was less important for Honolulu transit than other local factors such as a mild climate, a large tourist industry with some bus routes catering to tourists, and gasoline prices that are typically at least 20 percent higher than on the mainland.
The decline in transit commuting corresponds to the fall in gasoline prices 2014. While Honolulu prices are still higher than elsewhere, by early 2016 they had fallen by nearly 50 percent from their 2012 peak. Prices have partially recovered since then but still remain well below what they were between 2011 and 2014.
Table B08141 of the American Community Survey indicates that, between 2012 and 2018, the number of Oahu workers living in households with no cars declined by 9 percent while the number living in households with three or more cars increased by 11 percent, which may have been influenced by lower gas prices. I suspect it is this increasing auto ownership, fueled by low gas prices, that has eaten into Honolulu’s transit ridership.
Transit Operating Costs
After adjusting for inflation, Honolulu’s bus operating costs show an interesting pattern: from 1991 to 2005 they stayed relatively constant at about $9 per vehicle-revenue mile. One departure was in 1994, when costs leaped up to nearly $11 per mile, followed by a drop to $8 per mile in 1995, then a return to $9. A close look revealed that the 1994 increase and 1995 drop was entirely due to general administration, which grew from $19 million in 1993 to $30 million in 1994 and then just $9 million in 1995, after which it hovered around $16 million. My guess is that some major overhead cost that was intended for 1995 had been recorded during the 1994 fiscal year, but over time the average cost remained constant at about $17 million.
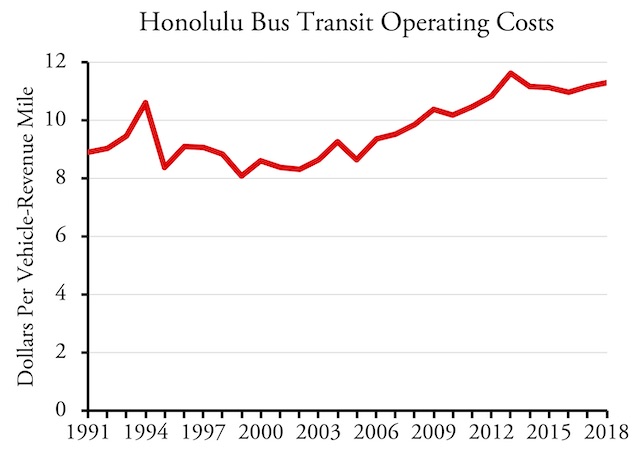
Excepting 1994-1995, the cost of operating Honolulu buses was roughtly constant, after adjusting for inflation, between 1991 and 2005 and between 2013 and 2018, but they unaccountably rose by 3.3 percent per year between 2005 and 2013.
The peculiar thing was not the change in general administration costs in 1994 but the sudden increase in all operating costs after 2005. After remaining constant (aside from the variations in general administration) for fourteen years, costs per vehicle-revenue mile started growing by an average of 3.3 percent per year, with growth in some years reaching as high as 8 percent. This growth continued until 2014 after which it leveled off again.
Two things happened in 2005 that might have resulted in this change. First, according to the National Transit Database, prior to 2005 buses were directly operated by the city of Honolulu, while after 2005 they were contracted out to a private operator. Second, in 2005 the Honolulu city council approved funding for rail transit. It may be that some of the rail planning costs were counted against the bus.
Contracting Out Transit
While most transit in the United States is operated by government transit agencies, some agencies contract out their transit services to others. In some cases, the contractors are other government agencies but in most cases they are private companies. Since contracting out is popular in Europe, three of the biggest companies that take up such contracts are European, two from Britain, First Transit and Stagecoach, and one from France, Veolia. In the National Transit Database, operations run by transit agencies are marked DO for directly operated, while operations that are contracted out are marked PT for purchased transportation.
The main reasons for contracting out transit operations are to save money or to provide more service on a fixed amount of money. In 1988, the Colorado legislature directed Denver’s Regional Transit District (RTD) to contract out 20 percent of its buses. This saved so much money that the legislature eventually increased the mandate to 50 percent.
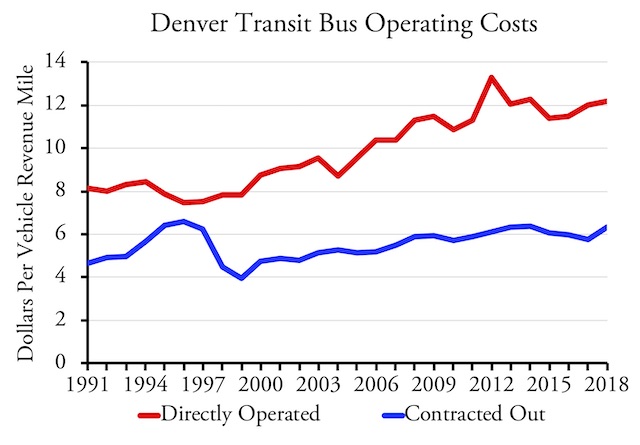
Despite tax disadvantages, private operators consistently cost RTD about 55 percent as much as it spends on its own bus operations.
RTD buys the buses both for its own operations and the contractors. Contractors buy the fuel (paying fuel taxes that RTD is exempt from paying) and maintain their buses (paying property taxes on the maintenance facilities that RTD is exempt from paying).
Contractors also hire the operators. The main opposition to contracting comes from transit unions. The contractors who now operate half of RTD’s buses are both unionized, but it is much easier negotiating union contracts with a public agency that depends on union endorsements to get federal grants and union voters to elect its board of directors than with a private company.
Despite being unionized and the tax disadvantages of private operations, the buses that RTD contracted out consistently cost less than buses it directly operated. For a few years in the mid-1990s, contractors saved only about 12 to 18 percent compared with directly operated buses, but for most other years it has been 40 to 50 percent.
As an aside, the state legislature clearly expected RTD to use the savings to increase bus service. Instead, it used the money to build the city’s first light-rail line, and then parlayed that into persuading voters to spend billions of dollars building more lines. While expanding bus service by 25 percent would almost certainly have attracted millions of new riders and increased transit’s share of travel and commuting, all of the light-rail lines built to date have resulted in a decline of transit’s shares.
Yet contracting out is still an excellent way to save money. Nationwide, the share of bus transit service that is contracted out has grown from about 5 percent in 1991 to 20 percent in 2018. The cost of contracted service was about 55 to 60 percent of directly operated buses in the 1990s, but it has grown to about 65 percent in the 2010s. This growth is probably because new services haven’t been as efficient as the early contracts.
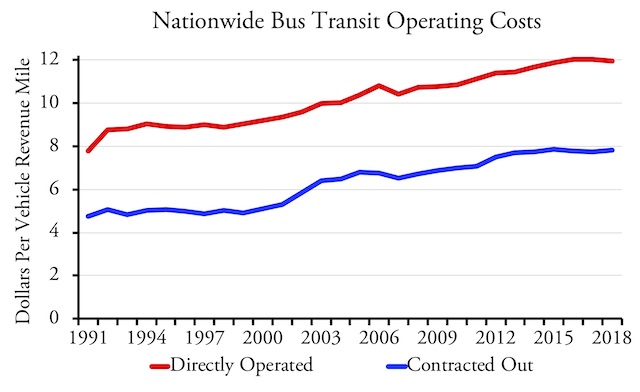
Nationwide, private operators save money over directly operated transit, though not as much as in Denver due to inefficient operations such as, it appears, the one in Honolulu.
Honolulu is one of those inefficient services. Nationwide, the average cost of directly operated buses was $11.98 per vehicle-revenue mile in 2018, while contracted buses cost just $7.84. Honolulu’s cost $11.31. While some of that may be due to Hawaii’s higher cost of living, much of it is due to the poor design of Honolulu’s contractor.
Instead of contracting out to a for-profit company such as First Transit or Veolia, which would have required a competitive bidding process, Honolulu contracted out to a non-profit organization called Oahu Transit Services. Wikipedia calls this a “public-private partnership,” but it is private in name only. I suspect there was no competitive bidding, as happens in Denver and many other cities whose transit agencies contract out operations. RTD’s contracts, for example, are put up for rebidding every five years, but I doubt Honolulu has ever put up its transit programs for bidding.
However, this does not seem to be the cause of the sudden rise in operating costs after 2005 because the city contract with Oahu Transit Services actually began in 1992, not 2005. Why the FTA records it as 2005 is unknown. But an email from the CEO of Oahu Transit Services, Roger Morton, stated that a 1990 city charter change created a Honolulu Public Transit Authority, which in turn selected the initial board of directors for Oahu Transit Services. Oahu Transit took over the previously private transit operations in 1992. The Honolulu Public Transit Authority dissolved in 1997 and since then Oahu Transit board members have been selected by the city’s director of transportation services.
Bus and Rail
Although Honolulu officials had talked about rail transit for many years, the Honolulu city council first approved funding for the city’s rail line in 2005. The city prepared an alternatives analysis report in 2006, a draft environmental impact statement in 2008, and a final environmental impact statement in 2010. It also had to do many engineering and design studies. These would have cost millions of dollars, yet the only funds reported in the National Transit Database are $110,102 in 2008, $21,020 in 2009, and $27,112 in 2010, for a total of $158,234 between 2005 and the commencement of construction.
As recorded in the database, the city started spending serious amounts of money on rail only in 2012, when it spent $245 million. By that time, the environmental impact statements were all completed and this $245 million would have been spent on rolling stock, rights-of-way purchases, and the commencement of construction.
The database shows that the city spent funds on bus capital improvements in the years prior to rail construction, ranging from $8 million in 2008 to $39 million in 2011. This is likely just for purchases of new buses. Since agencies don’t purchase the same number of buses every year, these numbers usually fluctuate, but the $22 million average for those four years is about the same as the average for the years before and since.
So where did the city get the money to pay for all the environmental, engineering, and design studies before it began construction? One possibility is that it came out of bus operating funds, thus providing an explanation for the increase in the operating cost per vehicle-revenue mile.
This wouldn’t be the first time that construction of a bloated rail project negatively impacted bus service. Between 2005 and 2013, Oahu’s population grew by 8 percent. The increased population generated higher tax revenues for Honolulu transit: between 2005 and 2013, local funds for transit operations almost doubled from $74 million to $138 million. Adding federal funds and fares and the total operating budget grew from $144 million to $223 million. Yet those increased revenues didn’t translate to better bus service: bus vehicle-revenue miles declined by 8 percent.
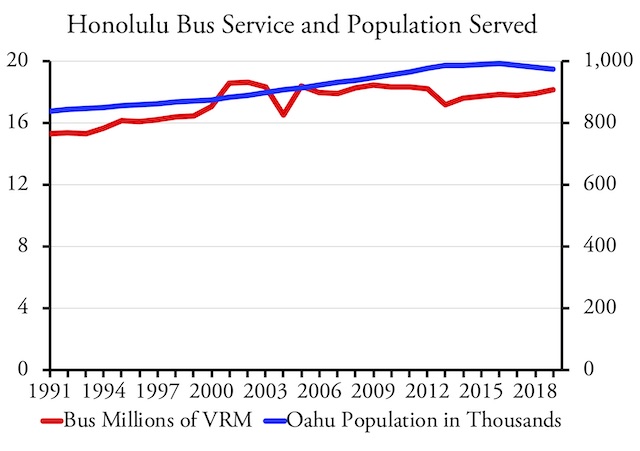
Despite Oahu’s growing population until 2016, bus service has remained flat since about the time the city decided to build rail. It is possible that the population decline since 2016 is partly due to the high taxes required to build the rail line.
It may only be a coincidence that Honolulu’s bus operating costs grew by more than 40 percent over a period of years in which bus vehicle-revenue miles declined, while at the same time Honolulu was spending tens of millions of dollars on planning, engineering, and designing a rail line whose costs aren’t reported anywhere in the transit data. It could be that something else was happening.
For example, to be eligible for federal capital funding, transit agencies must maintain cordial relationships with their transit unions. Perhaps Honolulu granted overly generous pay packages to the unions in order to get their support for the highly controversial rail line. Of course, that still doesn’t explain where the funds for planning the rail line came from.
The Terrible Folly
Honolulu’s decision to build rail was a terrible folly. The money being spent on rail construction plus the projected annual operating costs would have been enough to double Honolulu’s bus fleet and operate all of those new buses, replacing them every twelve years, for more than 80 years, which is far longer than the expected life of the rail line. Given the current rate of decline, it’s possible that the transit system won’t even be around for 30 years, much less 80 years, so the money committed to rail is a particular waste.
An added tragedy is the impact of the rail system on the bus system. Once one of the nation’s best, it is fast becoming as mediocre as it is in most other medium-sized urban areas. Whether that impact is due to a diversion of resources from buses to rails, as some of the data here suggest, or to other factors, it is highly likely that the Honolulu transit system would have been much better off today if it had never begun building rail.