Click image to download a four-page PDF of this brief.
The Futility of Trying to Reduce Driving
From The Antiplanner | March 10, 2020
Nearly fifty years ago, a friend of mine named Ron Buel (who at the time was the chief of staff to Portland city commissioner Neil Goldschmidt) wrote a book titled Dead End: The Automobile in Mass Transportation. Buel argued that cars harmed cities and the people living in them, and at the time he and other critics of the automobile seemed to make a lot of sense.
After all, in 1965, Ralph Nader’s Unsafe at Any Speed had shown that cars were death traps, killing almost as many Americans each year as ten years of the Viet Nam war. A look out a Portland window on a sunny day showed that cars were pollutomobiles, putting a grey layer of unhealthy smog over the city that was so thick people couldn’t see Mt. Hood, 50 miles away. In 1973, the OPEC oil embargo would make Americans painfully aware that their automobiles were also gas hogs.
What most infuriated central city officials such as Buel and Goldschmidt, however, was that cars allowed people to escape the taxation and regulation of the cities into the suburbs. City leaders viewed suburbanites as parasites, enjoying the benefits of the cities without paying the costs.
In 1972, the same year Buel’s Dead End hit the bookstores, the newly created (in 1970) Environmental Protection Agency adopted a two-pronged approach to reducing toxic air pollution. First, the agency required the auto industry to install catalytic converters and other equipment in new cars to reduce such pollution. It also ordered the oil industry to remove lead from gasoline. These rules would become increasingly stringent over time. Second, the EPA encouraged states and cities to adopt policies encouraging people to ride transit or use other alternatives to automobiles while discouraging people to drive.
Partly in response to Nader’s book, Congress created the Department of Transportation in 1966 and gave it authority over auto safety. Two years later the department issued new safety standards for automobiles, including requirements that all new cars had to be equipped with seat belts and that steering wheels had to be able to collapse on impact. The department created the National Highway Traffic Safety Administration in 1970, which adopted increasingly stringent safety rules, including requirements for child safety seats in 1970, three-point seat belts in 1975, air bags in 1984, and protection from side impacts in 1990. Today the rules include back-up cameras, curtain airbags, and electronic vehicle stability control.
In response to the oil embargo, Congress in 1975 ordered the Department of Transportation to impose the first corporate average fuel economy (CAFE) standards. The original standard required cars made in 1978 to average 18 miles per gallon, and this increased by one to two miles per gallon every year until 1985, when the standards reached 27.5 miles per gallon. By 2017, the standard reached 38.5 miles per gallon for cars, and 29.4 miles per gallon for light trucks.
Toxic Pollution
By any measure, the EPA’s efforts to reduce toxic air pollution by controlling the tailpipe emissions from new cars have been an outstanding success. Lead has been virtually eliminated as a transportation pollutant. Carbon monoxide, sulfuric acid, and volatile organic compounds produced by motor vehicles have declined by 90 percent. Nitrogen oxides are down almost 75 percent and particulates have fallen by half. Particulates, most of which come from Diesels, continue to rapidly decline due to new standards imposed in 2006.
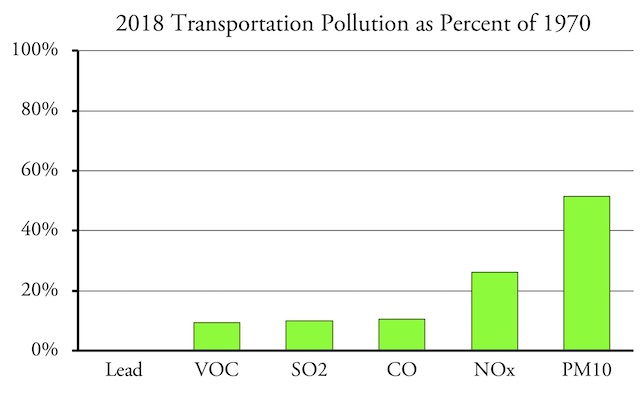
Americans drove three times as many miles in 2018 as 1970 yet most toxic air pollutants declined by 90 percent or more.
These improvements have happened in spite of the fact that total miles of driving have more than tripled, and urban driving has nearly quadrupled, since 1970. This means that the average car on the road today is only producing about 3.3 percent of most pollutants, per mile driven, as the average car in 1970. New cars sold today are down to 1 percent of new cars sold in 1970.
Safety
Highway fatalities in the United States peaked in 1972 at 55,600, which was 44.1 fatalities for every billion vehicle miles of travel. Since then, fatalities declined in most years, reaching a low of 32,479 in 2011, or 11.0 fatalities per billion vehicle miles. For some reason, fatalities increased between 2011 and 2016, but then fell again and in 2018 35,982 people were killed in auto accidents, a rate of 11.2 per billion vehicle miles.
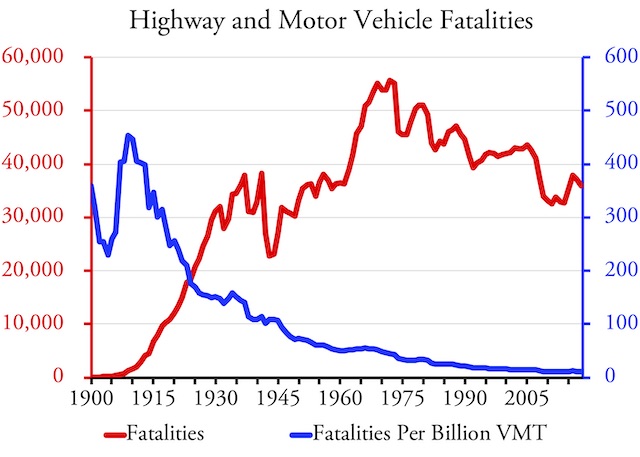
Motor vehicle fatalities have been on a downward trend since 1972, but fatality rates per billion vehicle miles have been declining since 1910.
No doubt the safety devices required by the federal regulations played a role in this 75 percent decline in fatalities per billion vehicle miles. However, it is worth noting that fatality rates per billion vehicle miles were declining long before the federal government imposed safety rules on the auto industry. In 1945, the rate was 107 fatalities per billion miles, well over twice the 1972 rate. In 19345 it was more than 150 fatalities per billion miles, and before 1918 it was well over 300.
It isn’t clear that the federal regulations had a major influence on the rate of decline in fatalities. In other words, it is likely that the auto industry would have installed many of the safety devices required by federal rules even without the rules.
In addition, much of the decline both before and after the federal regulations was due to improvements in highway safety. The interstate highways are the safest roads in America, and construction of the Interstate Highway System took cars from other roads where they were more dangerous. The slowdown in new freeway construction since the completion of that system may be responsible for as many fatalities as were reduced by the federal safety standards. Indeed, the failure of states to accommodate new traffic between 2011 and 2016 by building new roads may be the key reason why fatality rates increased during those years.
Energy
The average car and light truck on the road today gets double the number of miles per gallon as the average in 1970, according to the recently published 2020 edition of the Department of Energy’s Transportation Energy Data Book. Table 2.14 of that book says that the average car used 9,250 British thermal units (BTUs) per mile in 1970, which is approximately equal to 13.5 miles per gallon. By 2017, the most recent year shown in the table, BTUs per mile had fallen to 4,451, or 28.1 miles per gallon. Light trucks went from 10.0 to 20.3 miles per gallon. Vehicle occupancies (which are a reflection of family sizes) declined slightly during those years, but energy per passenger mile still improved by close to 50 percent for both cars and light trucks.
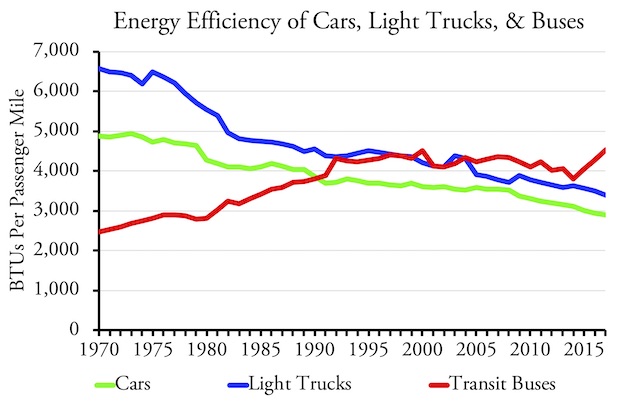
Cars have been more energy efficient than transit buses since 1991 while light trucks (pickups, SUVs, and full-sized vans) have been more energy efficient since 2004.
Transit went the other direction. The average transit bus went from 4.4 to 3.8 miles per gallon of Diesel fuel, partly because buses today tend to be air conditioned while buses in 1970 were not, but also partly because buses today are bigger: the long articulated buses found in many cities today were rare in 1970. Despite bigger buses, bus occupancies plummeted from 12.9 in 1970 to 8.0 in 2017. As a result, the energy required per passenger mile increased by 83 percent. Table 2.15 of the Data Book shows that rail transit energy per passenger mile also increased in this time period, but by only 11 percent.
CAFE standards are only partly responsible for the improvement in auto fuel economy. Much if not most of the improvement is a simple market response to higher fuel prices combined with improvements in auto technology. When fuel prices were low, people bought bigger vehicles that got as good or better miles per gallon as the smaller vehicles they previously owned because auto makers were able to increase ton-miles per gallon even if buyers weren’t interested in buying high-miles-per-gallon cars such as the Prius.
Discouraging Driving
EPA’s second strategy for reducing toxic air pollution, promoting alternatives to the automobile, was followed with enthusiasm in some cities and completely ignored in others. New freeway construction virtually halted in West Coast urban areas including Los Angeles, Portland, San Francisco-Oakland, and Seattle. Instead, these regions spent billions of dollars on new rail construction, bike paths, and other so-called sustainable transportation programs.
Meanwhile, urban areas in the center of the country, including Dallas-Ft. Worth, Houston, Kansas City, Indianapolis, and Phoenix, greatly expanded their freeway networks. While some of them built some rail lines, they made little effort to promote alternatives to the automobile and transit’s share of travel declined.
The Texas Transportation Institute’s latest urban mobility report includes a spreadsheet with data that can help analyze the effects of the anti-auto programs. These include population, freeway vehicle miles of travel, and gallons of fuel wasted due to congestion for all major urban areas from 1982 through 2017. The latest report doesn’t include freeway lane miles, but that was included in the institute’s 2012 spreadsheet for 1982 through 2011. Freeway lane miles for 2017 can be found in the Department of Transportation’s Highway Statistics report, table HM-72.
Urban planners say that building new roads “induces demand” for auto travel, and thus doesn’t relieve congestion even as the increased driving adds to energy consumption and pollution. Planners also say that increasing urban densities allows people to reach more destinations by transit, bicycles, and on foot. Finally, they argue that spending billions on alternative forms of transportation will reduce driving.
Two regions that stand out as polar opposites in their approaches to highway transportation are Houston and San Francisco-Oakland. San Francisco-Oakland’s population in 1982 was 2.9 million people, a half million more than Houston’s 2.4 million. The counties around San Francisco–Alameda, Contra Costa, Marin, and San Mateo–all had drawn urban-growth boundaries in the 1970s, so the Bay Area’s population density grew from 4,000 people per square mile in 1980 to 6,300 people in 2010 and 6,800 in 2017. Counties in Texas aren’t even allowed to zone, much less draw urban-growth boundaries, but population densities in the Houston area grew from 2,300 in 1980 to 3,000 in 2010 and 3,400 in 2017.
Within its constrained urban area, the San Francisco Bay Area built almost no new roads after 1982. In fact, freeway lane miles reportedly declined by 7 percent while non-freeway arterial lane miles grew by 27 percent. As Houston’s urban area expanded, its freeway lane miles grew by 146 percent and arterial lane miles grew by 88 percent.
The Bay Area spent well over $12 billion dollars expanding the BART system from 71 miles in 1982 to 109 miles in 2017. It also spent $3 billion increasing the miles of commuter train service by 50 percent and $4 billion upgrading 32 miles of San Francisco’s streetcar system to light-rail standards. Houston spent $3 billion building 20 miles of light rail.
Between 1982 and 2017, the Bay Area’s population grew by 22 percent, while Houston’s grew by 116 percent. Despite its rapid growth, Houston managed to increase the number of freeway lane-miles per capita by 14 percent whereas San Francisco’s declined by 24 percent.
All of Houston’s additional freeway growth “induced” per capita driving to increase by 27 percent. That increase in driving added to the region’s energy consumption, toxic air pollution, and greenhouse gas emissions.
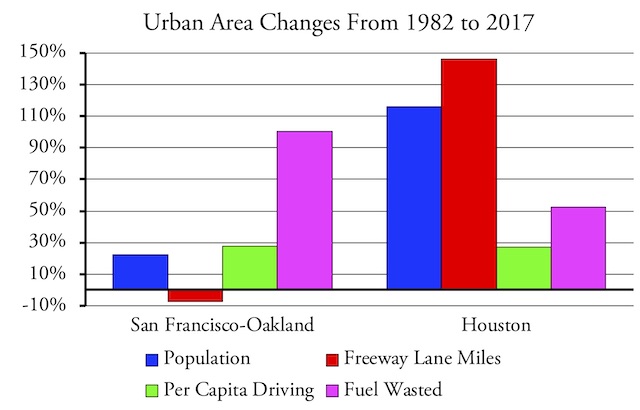
Houston built enough new freeway lane miles to keep up with population growth while San Francisco-Oakland expanded its rail system. Yet both saw about the same growth in per capita driving and the resulting congestion led San Francisco-Oakland to waste far more fuel.
Yet all of the Bay Area’s strategies to reduce driving failed to accomplish anything. Instead, per capita driving grew by 28 percent, slightly more than Houston’s. At the same time, per capita transit ridership declined by 24 percent from 170 trips per year to 129. Per capita ridership declined in Houston by 30 percent, but Houston wasn’t making an all-out effort to get people to ride transit.
What Houston did do was slow the growth of the region’s congestion. Houston had the second-worst congestion in the country in 1982 while the Bay Area was third. Houston congestion had increased by 2017, but it was only the ninth-worst in the country and San Francisco-Oakland had taken Houston’s place as second-worst.
Increased congestion translates to increased fuel wasted sitting in traffic, which increases the emissions of toxic pollutants and greenhouse gases. According to the Texas Transportation Institute, the amount of fuel wasted per commuter in Houston grew by 53 percent between 1982 and 2017, but in San Francisco-Oakland it grew by 100 percent. If the Bay Area had built highways to keep up with population growth as Houston did, it would have saved 22.6 million gallons of fuel per year. That translates to more than 200 metric megatons of annual greenhouse gas emissions.
City Control of the Suburbs
The hidden agenda behind much of the objections to the automobile and so-called sprawl is the desire of the cities to tax suburbanites, even if those people don’t live or work in the cities. Some states, including Indiana, North Carolina, and Texas, have given cities strong powers to annex suburbs, and it’s notable that these areas have made little effort to control suburban development.
Cities in states that have granted them weak annexation powers (such as allowing cities to annex suburbs only with the permission of the people being annexed) have turned to regional governments to control and tax the suburbs. These regional governments were originally created by a federal mandate in order to distribute federal housing and transportation funds to the municipalities within the region.
Many regional authorities have gone much further, however, using their tax authority to build expensive and useless projects, such as convention centers, rail transit lines, and sports stadiums, all of which feed the egos (and campaign funds) of regional officials but do little good for most residents. Regional governments also engaged in social engineering programs such as trying to get people to drive less. Many regional governments used their power to distribute federal funds to coerce suburban municipalities into going along with their land-use and transportation schemes. Given such profligate spending and nanny-state intrusions into individual lives, it’s no wonder that suburbanites flee the cities and tend to vote more conservatively than central city residents.
A Greenhouse Gas Strategy
At least some people who claim to worry about greenhouse gases admit that their real agenda is to transform the nation’s economy. As the chief of staff to Representative Alexandria Ocasio-Cortez admitted in May, 2019, the Green New Deal “wasn’t originally a climate thing at all.” Instead, it was “a how-do-you-change-the-entire-economy thing.”
Others take it for granted that reducing greenhouse gas emissions “means subways, streetcars and light-rail systems that are not only everywhere but affordable to everyone [and] energy-efficient affordable housing along those transit lines.” Naomi Klein, who wrote this, also thinks that “growing [food] in the South and shipping it by light rail” makes more sense than “growing food in greenhouses in cold parts of the United States,” so obviously she has no idea what “light rail” really is. (It’s low-capacity rail transit, not lightweight transportation.)
In any case, the EPA’s two-pronged approach to toxic air pollution should provide a lesson to anyone who sincerely wants to reduce greenhouse gas emissions and not merely use climate change to batter anyone they don’t like. San Francisco’s efforts to reduce driving by increasing densities, not building roads to keep up with population growth, and spending heavily on transit failed miserably and actually added hundreds of megatons of greenhouse gases into the atmosphere. Thus, it makes more sense to make cars that emit fewer greenhouse gases than to try to get people to drive less.
That may mean electric cars, but only in regions that get most of their electric power from sources other than fossil fuels, which pretty much excludes most of the United States at present. This is especially true since, when fossil fuels are used to generate electricity, delivering one BTU of energy to an electrical charging station requires burning three BTUs of fossil fuels at the power plant due to energy losses during generation and transmission.
Nor is it likely that the nation’s electrical grid will be converted to non-fossil fuel sources with enough generating capacity to support the transportation sector anytime soon. Transportation produces slightly more greenhouse gases than the nation’s electrical power plants, so the nation would not only have to convert the 63 percent of electricity that now comes from fossil fuels to other sources, it would also have to produce roughly 100 percent more electricity from non-fossil fuels than is now being produced by the entire electric industry to supply transportation needs.
Until we can economically quintuple non-fossil fuel production of electricity, it makes more sense to encourage the use of more fuel-efficient petroleum-powered cars. As noted in a previous policy brief, cars are already more energy-efficient than most transit and light trucks are tied with transit nationwide and ahead of transit in all but a handful of urban areas. Trying to get people out of their cars is a dead end. Making what is already a green form of transportation even greener will do more to save energy and reduce greenhouse gas emissions than heading up such a dead-end street.