Demographia United States Housing Affordability – 2022 Edition Released
News Release from Demographia, June, 2022
Demographia United States Housing Affordability rates middle-income housing affordability, using the median multiple, a measurement of income in relation to housing prices, or 189 major markets (metropolitan areas) for the third quarter of 2021.
Assessing Housing Affordability: Sometimes housing affordability is evaluated by simply comparing house prices. However, without consideration of incomes, housing affordability cannot be assessed with any real meaning for potential buyers. The very term “housing affordability” implies a relationship between housing costs and the ability to pay (or incomes).

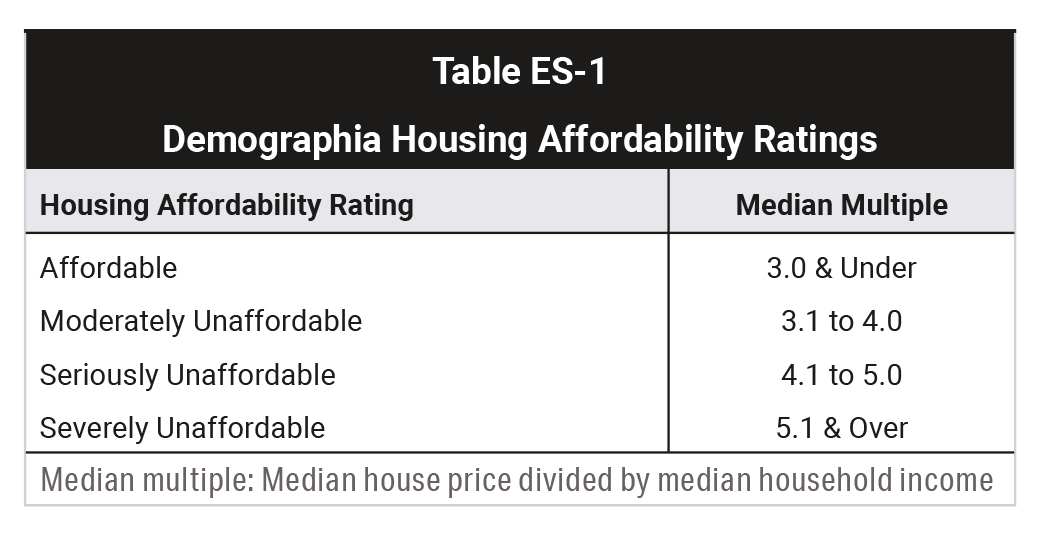
Demographia United States Housing Affordability uses the “median multiple” to rate middle-income housing affordability (Table ES-1). The median multiple is a price-to-income ratio, which is the median house price divided by the gross median household income (pre-tax).
Middle-income housing affordability is rated in four categories (Table ES-1)
Housing markets are metropolitan areas, which are also labor markets. In a well-functioning market, the median priced house should be affordable to a large portion of middle-income households, as was overwhelmingly the case a few decades ago.
Housing affordability comparisons can be made, (1) between housing markets (such as comparison between Cincinnati and Pittsburgh) or (2) over time within the same housing market (such between years in Cincinnati).
International Housing Affordability in 2021: Housing affordability in 2021 is considerably worse than before, with a five times increase in markets with at median multiples of at 10.0 or more as just a decade ago.
The least affordable market is Hong Kong, with a median multiple of 23.2, followed by Sydney at 15.3, Vancouver at 13.3, San Jose at 12.6 and Melbourne at 12.1. (Honolulu is 12.0)
The most affordable market is Pittsburgh, at 2.7, followed by Oklahoma City and Rochester at 3.3, with Edmonton and St. Louis at 3.6.
Housing affordability for all 92 markets is shown by median multiple in Table 4 and by nation in Table 5 (following Section 5 in the report).
The Pandemic Demand Shock: The pandemic has driven an unprecedented deterioration in housing affordability. Many households have sought more living space (inside and outside) during the pandemic. This has resulted in a “demand shock” The demand for housing rose faster than could be readily supplied by developers and builders.
The number of severely unaffordable markets — that is defined by median multiples over 5.0 — in the United States rose 440% from 14 in 2019 (the last pre-pandemic year), to 76 in 2021.
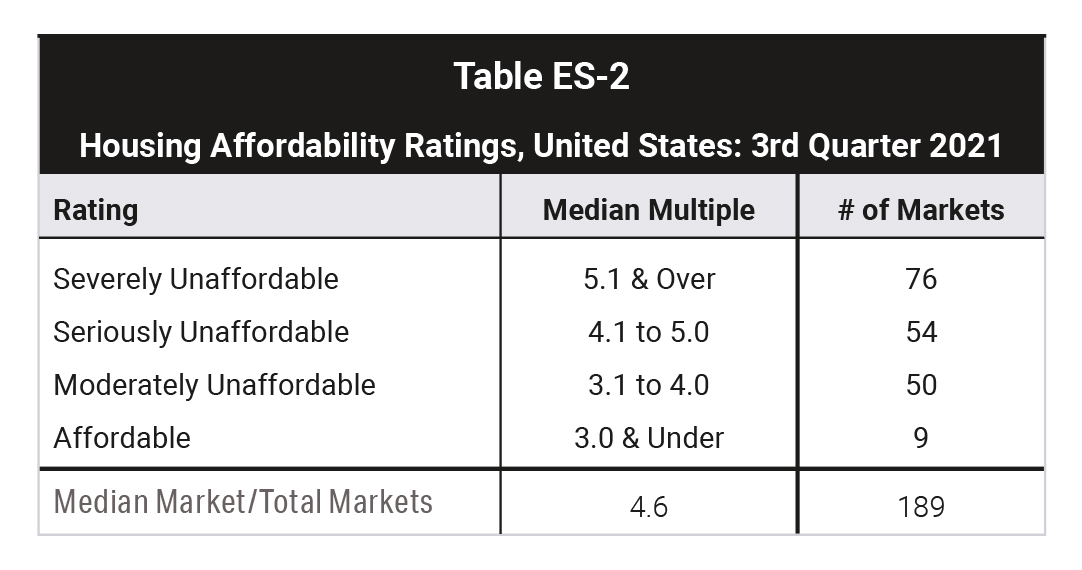
U.S. Housing Affordability in 2021: US housing affordability in 2021 is summarized by market in Table ES-2.

The number of markets rated “affordable” dropped to 9 in 2021, down 80 % from 44 last year. The most affordable markets were Peoria, IL (2.3), Davenport, IA (2.5), Rockford, IL and Pittsburgh, PA (2.7) — the only “affordable” major markets, as well as Cedar Rapids, IA, McAllen, TX and Youngstown, OH-PA (2.9). Erie, PA and Utica-Roma had median multiples of 3.0.
The 76 severely unaffordable markets in 2021 represented a nearly 125% increase from the 34 in 2020 and up more than 440% from 14 in pre-pandemic 2019.
Housing Affordability and Land Use Regulation: There is a broad view that declining housing affordability is driving higher costs of living that threaten the future of the middle-class.
In Under Pressure: The Squeezed Middle-Class, the OECD finds that the middle-class faces ever increasing costs of living and that rising owned house prices are the “main driver of rising middle-class expenditure.”
In the United States more than 85% of cost of living differences between high cost and average cost metropolitan areas are due to housing costs.
Academic research associates the declining housing affordability over recent decades with stronger land use regulation. In particular, urban containment regulation can produce substantially higher costs. In Rethinking Urban Sprawl: Moving Toward Sustainable Cities, OECD concludes that urban containment strategies (such as urban growth boundaries and greenbelts) must be accompanied by sufficient land for urban expansion to maintain housing affordability. This land needs to be competitively priced to keep house prices from rising disproportionately to incomes. In housing markets with the least affordable housing, urban containment policy is typical.
Housing Affordability and Inequality: French economist Thomas Piketty’s analysis has documented growing wealth inequality to the detriment of middle-income and lower income households. Other economists have found that much of this rising inequality is the result of inordinately increasing house values that have substantially retarded housing affordability. Reducing inequality requires material improvement in housing affordability . Policies should be adopted that restore the competitive market for land on the urban fringe and retain the competitive market where it remains robust.
Elaboration and sources are in the full report. Click here to read and download the full report.
* * * * *
PDF: DEMOGRAPHIA INTERNATIONAL HOUSING AFFORDABILITY
HB: Honolulu Challenges World’s Priciest Cities for Housing Unaffordability